Propulsion modelling: More efficient ship propulsion through statistical modelling and control.
- Modelling
- >
- Implementation
- >
- Dynamic
Dynamic modelsOverviewThe code presented here is used for the COMPIT'11 conference article A Machine-Learning Approach to Predict Main Energy Consumption under Realistic Operational Conditions. The article can be downloaded under the publications section. Dynamic Models IntroductionWhile the regression/instantaneous model predicts target values which are at the same place in time as the input values, the time-delay neural network setup can predict future values. The setup is also sometimes called a tapped-delay neural network. We will use a Markovian like model given by Xn+1 = f(Xn,Un,w) + Xn + e(n,w), where Xn+1 is the predicted next state, Xn the current, f is a function, which models the difference between the current state and the next state, where w are parameters that control the response of the function, and Un are the ship controls. Finally there is the error e. The variable Xn will express the dynamic state of the ship. It will contain the ship’s speed through water, trim, draft, and so forth. The value from the current step, Xn , is added to the right-hand side. The argument for doing this, is that we suspect the next step, Xn+1 , to be quite similar to Xn, and therefore the model will only have to learn the difference between the steps. Source codeThe source code and pre-processed data can be downloaded here. The pre-processing of the data implies outlier removal and feature extraction.
TrainingThe network is trained running the following command in IPython:
execfile('train_dyn_diff_model.py')
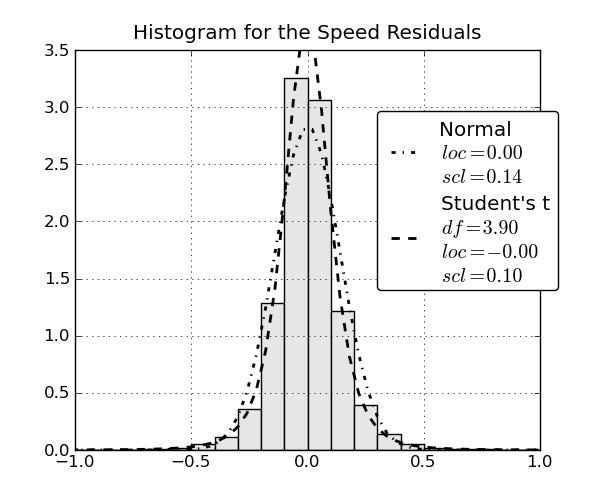
It will prompt the user for a filename where the model will be saved. The code checks if it is possible to train the models in parallel (using several processes on the same machine). You can tweak the training parameters in the code itself. ResidualsThe residual for the state variables can be plotted using the following calls:
execfile('visualize_dyn_diff_models.py')
results=cPickle.load(open('dynann20110702.pkl'))
plot_residual_hist(results)
A plot is generated for each state variable, and they should look something like this: 
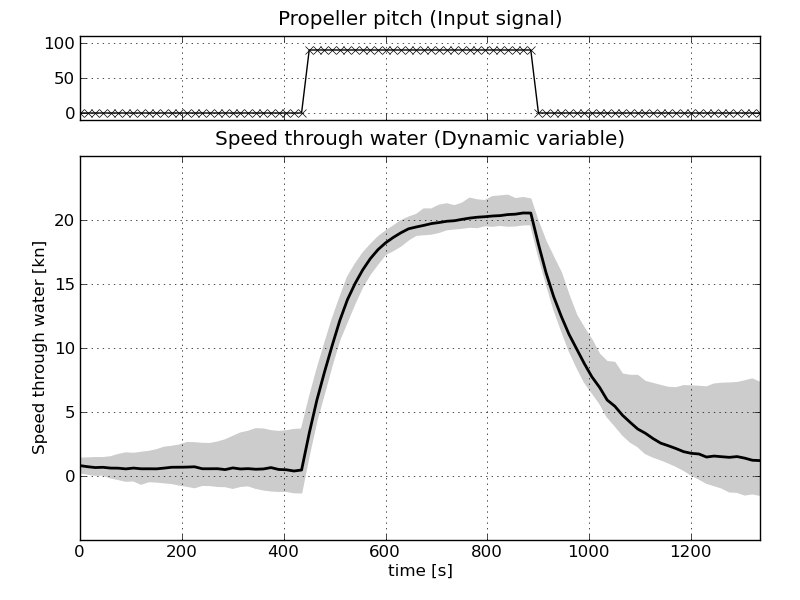
Step function exampleTo plot the systems response to a rectangular pitch input:
execfile('plot_pitch_step.py')
which should produce a plot like this: 
Return to Top |
|||||||||||||


